Application and service monitoring on Elastic APM
We check that your applications and services are up, how fast they respond and where errors appear. We combine metrics, logs and request traces (APM) in Elastic Observability, and also collect data through OpenTelemetry, so your team finds the cause of a problem faster.
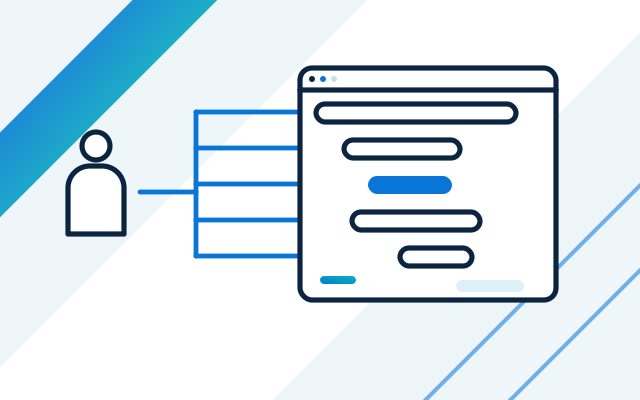
What application teams bring to us
-
The application is slow and nobody knows why
Users complain while server metrics look fine. Request traces show which part of the application or which database query takes the most time.
-
Errors only surface through tickets
Exceptions in the code sit in logs nobody reads. We collect them and show them together with the context of the request.
-
You cannot tell whether a service is available
A website or API stops responding outside working hours. We check availability from outside and alert straight away.
-
Many services, one failure
In a microservice architecture the source of a problem is hard to find. Distributed traces show the path of a request through every service.
Infrastructure monitoring tells you a server is up. Application monitoring tells you whether the thing that server exists for works: whether a user can log in, place an order or download data, and how long it takes.
We collect application data on the same platform as infrastructure and logs, so going from symptom to cause does not mean switching tools. We show results on dashboards built for your teams.
How we price
We set the price after getting to know your application. It depends on the number of applications and services, technologies, data volume, retention time, and the scope of maintenance and on-call cover.
What we do
- We monitor the availability of services, websites and APIs, checked from outside
- We measure response times and point out slow parts of the application
- We collect errors and exceptions together with request context
- We implement request tracing (APM) in applications, including with OpenTelemetry
- We link metrics, logs and traces so you can go from an alert to the cause
- We monitor web applications and services in the cloud and on-premise
- We build dashboards and alerts for application teams
- We maintain the platform and provide on-call cover as set out in the contract
Who it is for
- You are responsible for an application whose downtime costs the company revenue or reputation
- You run many services and find it hard to trace the cause of an error
- You want to know about a problem before your customers do
- You develop applications and need performance data after every release
From alert to root cause
An error alert is only half the information. We link metrics, logs and request traces, so one place shows what broke, where, and after which release.
- Request traces across all services (APM)
- Application logs linked to a specific request
- Application behaviour compared before and after a release
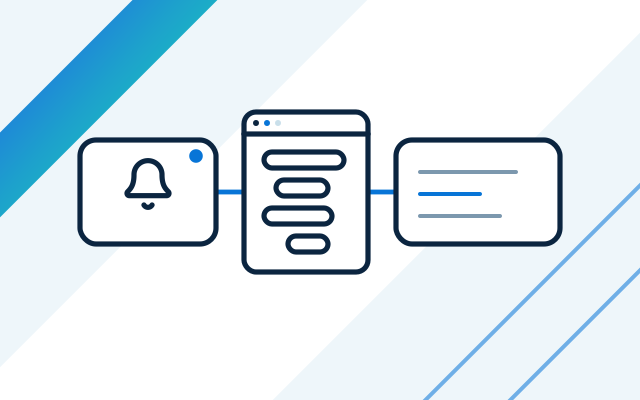
Availability and web applications
We check whether a site and its API respond, how fast and with which status code. We monitor web applications from the user's side and give teams the data to base performance decisions on.
- Availability checks from outside
- Response times and error codes
- Alerts escalated to the right team
How we work
- 1
Getting to know the application
We learn the architecture, technologies and the places where problems most often appear.
- 2
Measurement plan
We agree what to measure: availability, response times, errors and traces, and choose agents or OpenTelemetry.
- 3
Implementation
We instrument the applications, connect data sources, and build dashboards and alerts.
- 4
Maintenance and on-call
We tune alerts after application changes and respond to events within the scope of the contract.
Experience
- Relipoint is an official Elastic partner, and our team holds Elastic accreditations in Observability.
Frequently asked questions
What is APM?
APM (application performance monitoring) tracks how an application performs. It shows how long each request takes, which services handle it and where errors occur.
Do we need to change our application code?
Usually very little. In many technologies it is enough to add an agent or an OpenTelemetry library. We agree the scope of changes after reviewing the application.
Do you monitor applications in the cloud?
Yes. We work with AWS, Azure and Google Cloud as well as applications on your own servers, and show them in one system.
How is application monitoring different from infrastructure monitoring?
Infrastructure is the servers, network and cloud. Applications are the services, websites and APIs that run on them. We usually implement both kinds of monitoring, because problems often sit where the two meet.
See also
-
IT infrastructure monitoring on Elastic
Servers, networks, server rooms, hardware and clouds in one monitoring system: data, dashboards and alerts on Elastic Stack.
-
Log management in Elasticsearch and Kibana
Logs from applications, clouds, networks, virtual machines and hypervisors on one platform: collection, search, retention and alerts.
-
Kibana dashboards: data visualisation, reports and alerts
Kibana dashboards, and Grafana where data comes from other sources: charts, maps, tables, reports and alerts for IT teams and management.