Log management in Elasticsearch and Kibana
We collect logs from applications, servers, virtual machines, network devices and clouds in Elasticsearch, using Elastic Agent, Beats and Logstash. You search and analyse them in Kibana and store them for as long as your company or regulations require. We implement and maintain the platform.
What companies bring to us
-
Logs sit on each server separately
Finding the cause of an error means logging in to several machines and reading files. We centralise the logs, so one search is enough.
-
Logs disappear before you need them
Rotation deletes old files, and an audit or investigation needs data from months ago. We set retention to match your needs and regulations.
-
Log formats differ from system to system
Every application and device logs differently. We normalise events so they can be compared and searched.
-
The log platform costs too much
Data volumes grow and the bill grows with them. We choose storage tiers and filter out what does not need to be kept.
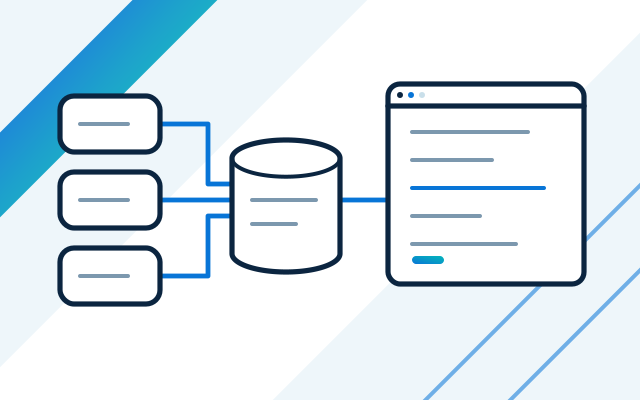
Logs record what systems do. They usually arise in dozens of places and in different formats, so people turn to them only when something breaks. Centralisation turns them into a working tool: you search events from all sources together and compare them over time.
Logs also feed infrastructure monitoring and application monitoring, dashboards in Kibana and Grafana, and the SIEM, which uses them to detect threats.
How we price
We set the price after taking stock of your sources. It depends on the number of log sources, daily data volume, retention time, the deployment model, and the scope of maintenance and on-call cover.
What we do
- We collect logs from applications, operating systems and services
- We collect logs from AWS, Azure and Google Cloud
- We collect logs from network devices: routers, switches, firewalls and load balancers
- We collect logs from virtual machines and hypervisors
- We collect hardware logs from IPMI
- We normalise and enrich events so they can be searched
- We set retention and data storage tiers
- We build searches, dashboards and alerts based on logs
- We maintain the platform and provide on-call cover as set out in the contract
Who it is for
- Your logs are scattered across servers, clouds and devices
- You need to keep logs for audit, incident analysis or regulatory compliance
- You spend too long finding the cause of errors because many sources must be checked
- You want to cut the cost of your log platform without losing the data you need
One place for logs from the whole company
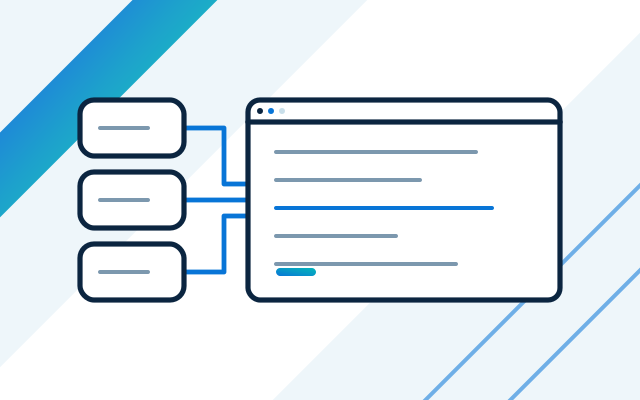
Logs from applications, clouds, networks, virtual machines and hardware land on a single platform. In Kibana you search events from all sources at once and compare them over time.
- Applications and operating systems
- AWS, Azure and Google Cloud
- Routers, switches, firewalls and load balancers
- Virtual machines, hypervisors and hardware (IPMI)
Retention without overspending
Not every log needs to be kept the same way. Recent data stays quickly available, older data moves to cheaper storage, and what you do not need is filtered out at the source. We agree the retention period with you.
- Data storage tiers
- Filtering out unnecessary events
- Retention periods that meet audit needs

How we work
- 1
Source inventory
We list where logs come from, in what format and how long they must be kept.
- 2
Architecture
We choose agents (Elastic Agent, Beats, Logstash), the deployment model and the cluster size.
- 3
Implementation
We start log collection, normalisation, searches and alerts.
- 4
Maintenance and on-call
We watch cluster performance, costs and retention, and respond to events within the scope of the contract.
Experience
- Relipoint is an official Elastic partner, and our team holds Elastic accreditations in Observability and Security.
Frequently asked questions
How long can logs be kept?
As long as we agree. The period depends on your needs, audit requirements and budget. We move older data to cheaper storage so costs do not grow in step with volume.
Do you collect logs from our network devices?
Yes. We collect logs from routers, switches, firewalls and load balancers, and from virtual machines and hypervisors. We normalise the events in the platform so they can be compared.
Can we stay on our current log platform?
Yes. We also work with Grafana Loki and Splunk. If your current solution is too expensive, we cover migration in our monitoring migration service.
Can logs be used to detect threats?
Yes. The same data feeds a SIEM, which detects suspicious events through correlation and rules. We describe this on the SIEM and security page.
See also
-
IT infrastructure monitoring on Elastic
Servers, networks, server rooms, hardware and clouds in one monitoring system: data, dashboards and alerts on Elastic Stack.
-
SIEM and IT security on Elastic Security
SIEM on Elastic Security: threat detection, correlation, alerts, response automation (SOAR), EDR, reports and compliance.
-
Migration to Elastic: from Splunk, Datadog and other platforms
Migrations to Elastic Stack from Splunk Cloud, Datadog and other platforms: audit, data transfer, dashboards and alerts. Grafana as an option.
-
Elastic Stack implementation: licences, deployment and support
Official Elastic partner: licences, implementation, cluster cost and performance optimisation, maintenance and on-call.