Kibana dashboards: data visualisation, reports and alerts
We build Kibana dashboards on Elasticsearch data: charts, maps, tables, reports and alerts that show the state of your infrastructure, applications and security. We design them with the people who use them. We show data from Prometheus or Loki in Grafana.
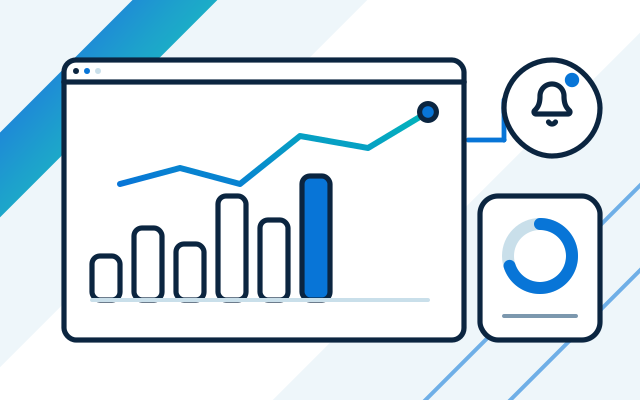
What teams bring to us
-
The data is there, but nobody reads it
The platform collects thousands of metrics, yet the team still asks about system status. We design dashboards around the questions you ask most often.
-
Management wants a report, IT has a table
Results must be presented in a form that people outside IT can follow. We prepare reports with key indicators on an agreed schedule.
-
Alerts go to everyone or to no one
Too many notifications end in being ignored. We set thresholds and channels so that the alert reaches the person who can act.
-
The picture of the network is unclear
Scattered locations and devices are hard to take in from a table. Maps and heat maps show where the problem is.
A dashboard is good when it answers the question its user comes with. So we start with a conversation with the people who will use it, and only then choose the charts.
Dashboards combine data from infrastructure monitoring, application monitoring and logs, and for security teams from the SIEM as well.
How we price
We set the price after learning what you need. It depends on the number of dashboards and reports, data sources, user requirements, and the scope of training and maintenance.
What we do
- We design dashboards in Kibana and, for other data sources, in Grafana
- We prepare charts, gauges, tables and maps, including heat maps
- We build recurring reports with key indicators for IT and management
- We set up alerts and their channels: who is notified, when and how
- We combine infrastructure, application, log and security data on one screen
- We show your team how to create and change dashboards themselves
- We maintain dashboards as your environment changes
Who it is for
- You have monitoring data but lack a clear picture
- You need regular reports for management or customers
- You want your team to see faster what needs action
- You use Kibana or Grafana and want to make better use of them
Dashboards for specific teams
An administrator, a developer and an IT director ask different questions. We prepare a view for each with what matters to their work, all drawing on the same data.
- Operational dashboards for IT teams
- Views for application owners
- Summaries for management
Reports and alerts
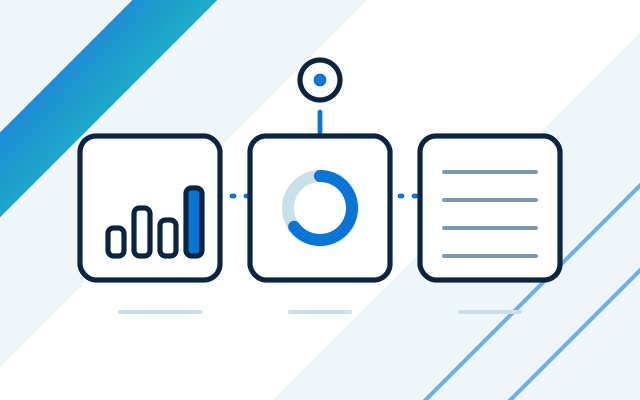
We deliver recurring reports on an agreed schedule and route alerts to the right channels. We choose thresholds so that an alarm means a real problem.
- Reports on a fixed cycle
- Alerts with escalation
- Maps, heat maps, tables and gauges
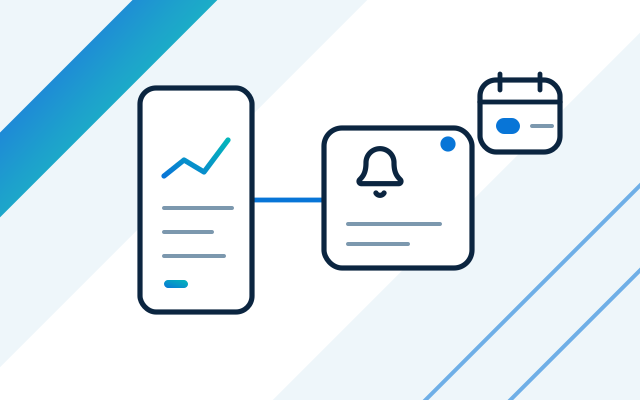
How we work
- 1
Conversation about needs
We establish who will use the dashboards, which decisions they base on them and how often.
- 2
View design
We prepare the dashboard layout and go through it with the users.
- 3
Build
We build dashboards, reports and alerts on the data in your platform.
- 4
Handover
We show your team how to change dashboards and maintain them as your environment changes.
Experience
- Relipoint is an official Elastic partner. We build dashboards mainly in Kibana, and add Grafana where data comes from other sources.
Frequently asked questions
How is Kibana different from Grafana?
Kibana is an Elastic tool that works on data in Elasticsearch and is strongest with logs. Grafana connects to many sources, including Prometheus and Loki. We choose the tool to suit your data and team, and often use both.
Can you build dashboards on our data from another platform?
Yes, if the data can be loaded into Elasticsearch or connected as a source in Grafana. We check this at the start of the conversation.
Will our team be able to change the dashboards themselves?
Yes. We show you how, and we handle the more complex changes.
Do you deliver reports regularly?
Yes. We can prepare reports on a recurring basis and deliver them to an agreed group of recipients.
See also
-
IT infrastructure monitoring on Elastic
Servers, networks, server rooms, hardware and clouds in one monitoring system: data, dashboards and alerts on Elastic Stack.
-
Application and service monitoring on Elastic APM
Availability, response times, errors and request traces for web applications and services: Elastic APM and OpenTelemetry.
-
Log management in Elasticsearch and Kibana
Logs from applications, clouds, networks, virtual machines and hypervisors on one platform: collection, search, retention and alerts.
-
Elastic Stack implementation: licences, deployment and support
Official Elastic partner: licences, implementation, cluster cost and performance optimisation, maintenance and on-call.