IT infrastructure monitoring on Elastic
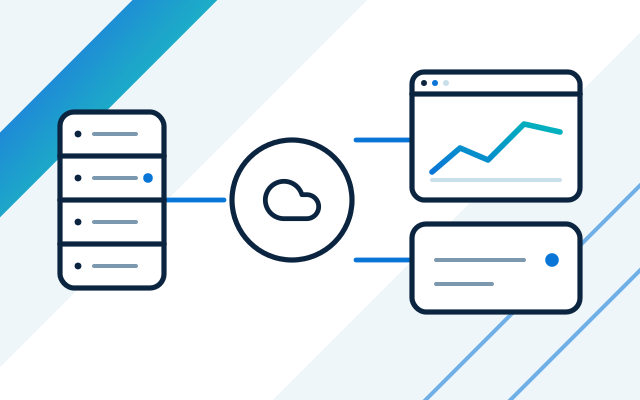
We monitor servers, networks, server room conditions and AWS, Azure and Google Cloud in Elastic Observability. Data from over 200 integrations lands in Elasticsearch, and Kibana dashboards and alerts show a problem before users notice it. We implement, maintain and provide on-call cover.
What IT teams bring to us
-
Users report the outage first
You hear about a failure from the office, not from a system. We set up monitoring that warns about rising load, low disk space and unreachable services.
-
Every environment has its own tool
On-premise servers, the cloud and the network each have a separate console. We bring data from all of them into one platform and one dashboard.
-
Hardware fails without warning
A disk, power supply or fan gives up and nobody saw the signs. We read hardware parameters over IPMI and warn before a failure.
-
The server room is getting too warm
Temperature, humidity or a leak are risks your IT systems know nothing about. We add environmental sensors to the monitoring.
Infrastructure monitoring starts with a question: what must keep running, and how quickly do you want to know it has stopped? The answer decides which data we collect, how often, and when an alert reaches a person.
All data goes into one store on Elastic Stack and is available on dashboards in Kibana or Grafana. We build the dashboards and rules with your team so they show what you act on. If you want to see applications too, we add application monitoring, and we collect logs as part of log management.
How we price
We set the price after a conversation. It depends on the number of servers, devices and clouds, the volume of data, retention time, the deployment model, and whether you also want maintenance and on-call cover.
What we do
- We monitor physical and virtual servers: CPU, memory, disks, services and processes
- We collect data from routers, switches and firewalls: bandwidth, latency, packet loss and errors
- We read hardware health over IPMI: disks, temperatures and power supplies
- We monitor server room conditions: temperature, humidity, leaks, smoke and airflow
- We monitor AWS, Azure and Google Cloud, including resource costs
- We cover on-premise and hybrid environments
- We build dashboards and alert rules together with your team
- We maintain the platform and provide on-call cover as set out in the contract
Who it is for
- You run your own servers and network and want to see their state on a single screen
- You have a hybrid environment with some services in AWS, Azure or Google Cloud
- You have a server room and need to track hardware and environmental conditions
- Your current tools raise too many false alarms or do not show the whole picture
Hardware, network and server room
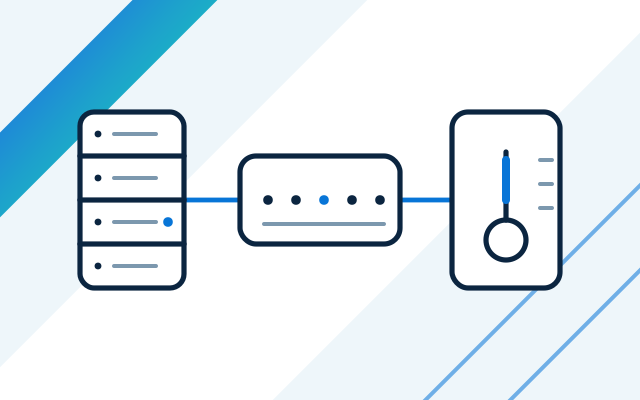
We monitor the layer everything else depends on: the health of disks, temperatures and power supplies, and the parameters of network devices. We read hardware data over IPMI, even when the operating system is not responding.
- Disks, power supplies, fans and server temperatures
- Bandwidth, latency, packet loss and link errors
- Temperature, humidity, leaks and smoke in the server room
Cloud and hybrid environments
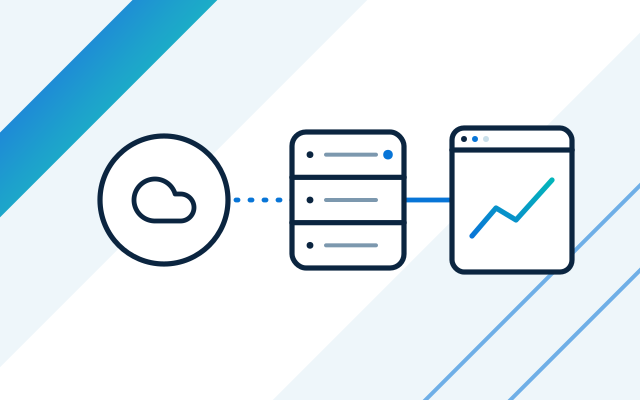
We monitor resources in AWS, Azure and Google Cloud the same way as on-premise servers. We show load, response times and resource usage, plus costs, so the cloud bill holds no surprises.
- Integrations with AWS, Azure and Google Cloud
- One dashboard for the cloud and the server room
- Cost tracking for cloud resources
How we work
- 1
Environment review
We establish what you have, what is critical and which data you already collect.
- 2
Concept
We choose data sources, agents and the platform architecture, and propose what to monitor and which thresholds to set.
- 3
Implementation
We install Elastic Stack, connect servers, networks, clouds and sensors, and build dashboards and alerts.
- 4
Maintenance and on-call
We update the platform, tune alerts and respond to events within the scope agreed in the contract.
Experience
- Relipoint is an official Elastic partner, and our team holds Elastic accreditations in Observability.
- We work with over 200 integrations, including AWS, Azure and Google Cloud.
Frequently asked questions
What can you monitor?
Physical and virtual servers, network devices, hardware over IPMI, server room conditions, and resources in AWS, Azure and Google Cloud. With over 200 integrations, we can usually connect unusual systems too.
Will you replace our current tool?
We can, but we do not have to. Sometimes it is enough to add missing data sources or tidy up the alerts. If your current platform is too expensive or too limited, we cover migration as a separate service.
Does monitoring work in our cloud and on our own servers at the same time?
Yes. We collect data from on-premise and cloud environments into one platform, so a single dashboard shows everything.
Do you also check backups?
Backup verification is handled by Conetso Group as part of its managed IT services. We monitor the infrastructure and services.
See also
-
Application and service monitoring on Elastic APM
Availability, response times, errors and request traces for web applications and services: Elastic APM and OpenTelemetry.
-
Log management in Elasticsearch and Kibana
Logs from applications, clouds, networks, virtual machines and hypervisors on one platform: collection, search, retention and alerts.
-
Kibana dashboards: data visualisation, reports and alerts
Kibana dashboards, and Grafana where data comes from other sources: charts, maps, tables, reports and alerts for IT teams and management.
-
Elastic Stack implementation: licences, deployment and support
Official Elastic partner: licences, implementation, cluster cost and performance optimisation, maintenance and on-call.
-
Conetso Group
Backups and server administration
Backup verification and server and network administration are handled by Conetso Group.